Visualizing Data for Annual Reports
"The goal is to turn data into information and information into insight."
―Carly Fiorina, former Hewlett-Packard CEO
Thank you to Robert Cubey, from the Royal Botanic Garden of Edinburgh, for sharing his reporting methods and insights and to everyone who participated in the community challenge. The discussion challenged everyone to think about how to tell the story of the collection to different audiences and what has changed over time. We look forward to hearing more discussion about reporting in the forum on in the comments at the end of this article.
|
Thanks to all of you who joined us! The Coffee Chat attendees were mostly intermediate users, at 50%, with an additional 14% of users identifying as novice, and 36% as advanced users of the software.
At the end of this article, we share a list of Q&A from the chat section of the Coffee Chat. Thank you for all the engagement! |
Poll Questions:
RBGE Reporting
Quarterly Reports
1. Number of Accessions
2. Number of Accessions added
3. Number of Accessions under Glass
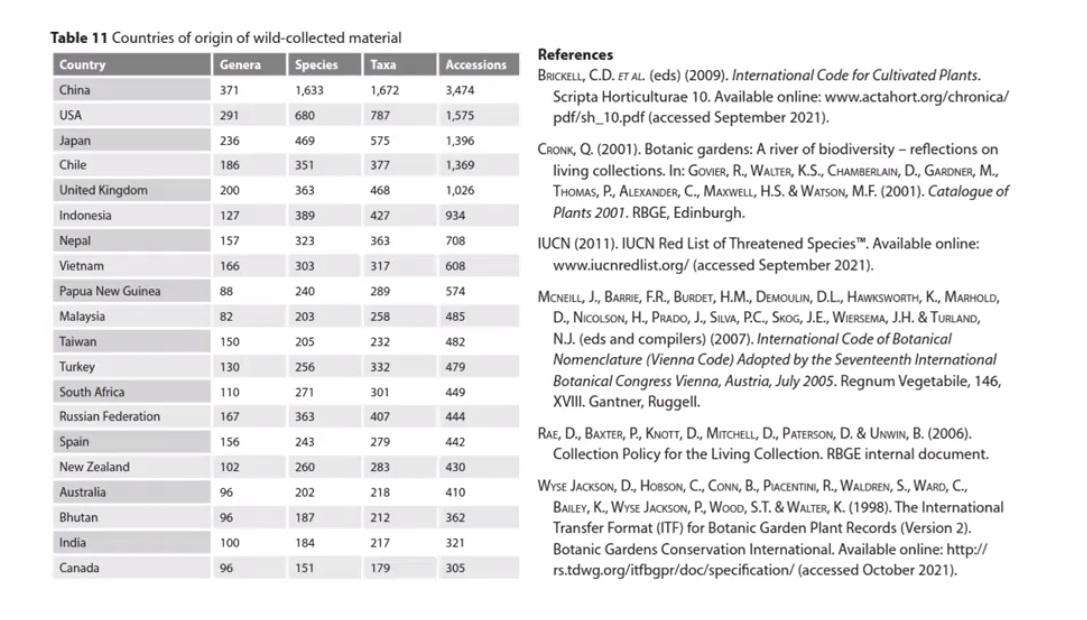
4. Number of Accessions with a wild provenance in the collection
5. IUCN Threat Category
4-5 Years a Catalogue is produced. These have been made since 1683.
2021 Catalogue of Plants
IrisBG Dashboard
Click on the image below to download this excel template to use for your garden.
🌱In Excel, select from the Review Tab, "Show Comments" in the document for more tips.
Questions and discussions about the challenges in creating plant records reports:
Q: What to do when data is reported in mass and not by item?
When recording data it is possible to specify the number of specimens within an accession record. If a number is entered a custom report can be run that calculates the number of specimen. See article Create customized reports. The 'Spec No' field will need to be added to an Item report to provide a report for this field.
⚠️ It is possible to enter a range of numbers or use words like "mass" in the number of specimens field. When data is entered this way it is not possible calculate the total number of accession items.
Q: Are there recommendations for how to address issues that come up if the records needed for the report are not up to date or need cleaning to be useful?
Can the inconsistencies in data entry be a learning opportunity for consistent record keeping between staff?
Q: How many taxonomic names were verified this year?
Use the Stat06 Collection Count report.
Other thoughts:
Report just on one area that was covered thoroughly and make a plan to cover other areas in the following year(s) and display the information in a way that gives insight for how to improve data collection.
🌱 Be thoughtful in the way the data is counted and shared. Display data in a way encourages staff to continue entering the data and not in a way that discourages keeping records or creates apprehension about accountability.
Use the data in ways to solve problems in the garden:
-
- Why are all the plants in a certain section of the garden dying? Pathogen? Irrigation Problems?
- Is the plant selection still appropriate for changes in the local climate?
- Are plants replaced when they are removed?
Robert's recommended list of what to track to show the state of plant records (and a few suggested visuals)
- Is the entire institution recording changes? (Use the Items02 report to create the Radar Chart below. The green line is the total number of records and orange line is the records that changed in 2023.)
- Item location and Item Coordinates (Do they match/make sense?)
- Example solutions:
- Create an inspection event of items that have been moved and create map reports that filter these accessions by location.
- Use GIS to plot items by item coordinates with the symbology categorized by location. It is best to have a polygon layer or base layer underneath to provide extra confirmation about location.
- Example solutions:
- New Taxa Provenance Breakdown (Use the Item02 report to create this stacked bar graph)
- New acquisitions of mature or rare items, How long are they lasting?
- Create an report of item history of the rare items.
- What are the turn over rates in particular areas in the garden? (Use the Item02 report to create the graph below.)
Want to create your own Dashboard?
Attached is the template used in the video that you can use for your own reports.

Comments
0 comments
Please sign in to leave a comment.